

 English
 简体中文
简体中文
 Bahasa Indonesia
 Bahasa Melayu
 Tiếng Việt
 ไทย
ไทย
 Español
 Português
 日本語
日本語
 Arabic
 한국어
한국어
17 May 2021

Weekly Market Forecast 17 - 21 May 2021
Trading Updates
NASDAQ
After a bullish run, the price seems to have slowed down and created a bearish divergence on weekly time frame, based on the moving averages of the MACD indicator. It’s possible that a bearish corrective movement might take place here.

On the Daily time frame, it’s possible to see the price breaking below the most recent uptrend line and this breakout is being retested now. If the key resistance zone between 13600 – 13900 holds, it’s possible that the sellers might be in control here and expect further continuation lower.

On the H4 chart the price structure seems very clean with series of lower highs and lows, so my view here is to look for further continuation lower after current pullback.

EURJPY
EURJPY appears to have reached the weekly resistance zone around the area of 133 – 134 and it seems to be respecting it so far. MACD supports the bearish view by creating a bearish divergence on the histogram of the MACD. These could be signs of a potential bearish corrective move coming.
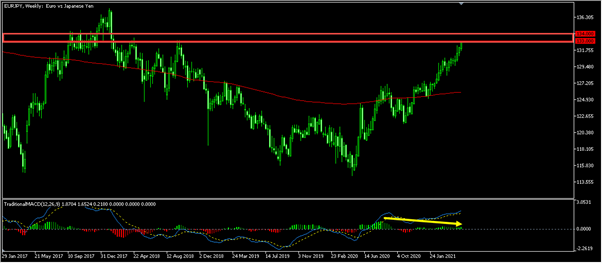
MACD is developing a potential bearish divergence on the daily time frame, this is usually a sign that the buyers are losing momentum and a solid sign that the sellers are increasing their interest which strengthens the possibility of a bearish correction.

If the price breaks below the rising trend line on the H4 chart, then it should be a good sign that the bearish correction begins.

EURCAD
After the strong bearish move, the EURCAD seems to have slowed down and has now reached a strong supportive zone (1.47 – 1.45) on the daily time frame. Followed by a bullish divergence based on the moving averages of the MACD indicator which favours the buyers. Based on this technical analysis, I expect some bullish pullbacks to happen here.

On the H4 chart, the price bounces upside after completing three waves down. The bullish divergence on the moving averages of the MACD hints the possibility of a bullish correction of two waves (ABCD correction) upside to happen here. As long as the support zone between 1.4650 – 1.4620 holds, it’s possible that there will be one more rally towards the next resistance zone.


 1
1
Register & Verify your Profile
 2
2
Open a Live Account & Fund It
 3
3