31 May 2021

Weekly Forecast - May 30 - June 4
Trading Updates
AUDCAD
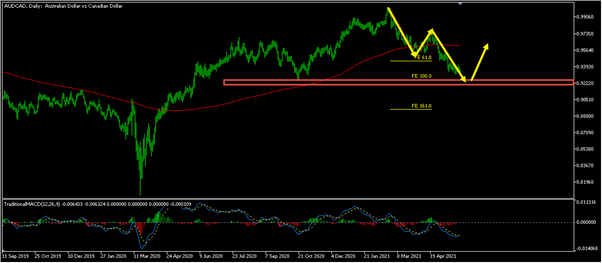
On the daily time frame, a double wave down meeting the 100% Fibonacci expansion level of the first wave may be seen and the key support zone coincides around 0.92 – 0.93 area which could make it a key trading zone.

It seems that the bearish trend is coming to its end, and a bullish divergence based on the MACD indicator may be seen. As long as the daily key zone holds, it seems that the sellers will lose their control and the buyers will step in.

AUDNZD
The daily seems to have created a series of lower highs and lower lows which could be pointing to a bearish momentum. The price broke below the recent support zone and the rising trend line, providing more signs to favour the bearish view. It’s possible that the current bearish trend might continue further.

After expected pullbacks, it seems that the sellers are likely to keep their control and push the prices further down towards the next support zone.

CADJPY
The price seems to be currently nearing a key resistance zone formed by the previous weekly highs. A slow down based on the MACD histogram may also be evident. These could potentially be signs of a slowing down bullish momentum and potential correction down.

Bearish divergence seems to also be developing on the MACD indicator on the daily time frame which supports the bearish view. As mentioned before, it seems that the bullish run could be coming to its end and bearish correction is likely to begin from the key zone.

 1
1
Register & Verify your Profile
 2
2
Open a Live Account & Fund It
 3
3


 English
 简体中文
简体中文
 Bahasa Indonesia
 Bahasa Melayu
 Tiếng Việt
 ไทย
ไทย
 Español
 Português
 日本語
日本語
 Arabic
 한국어
한국어

